Graphical interface for data analysis using ROOT
ROOT-A-TRON 3000
How it works:
- Add your measurements - choose XY, histogram or multivariate data, then paste or type your values and uncertainties.
- Choose a model from the library or write your own equation.
- Set starting values (adjust the curve until it follows your data, or ask an AI for them), then press Fit.
Tip: Stuck? Give your data and your model’s equation to an AI model, ask it for starting values, and enter them manually. If you just need the fit rather than practice choosing values, this is the recommended shortcut.
- Read your results: parameters with uncertainties, χ²/NDF, p-value and residuals. Export the plot, or take the parameters into Analyze Data to calculate further quantities.
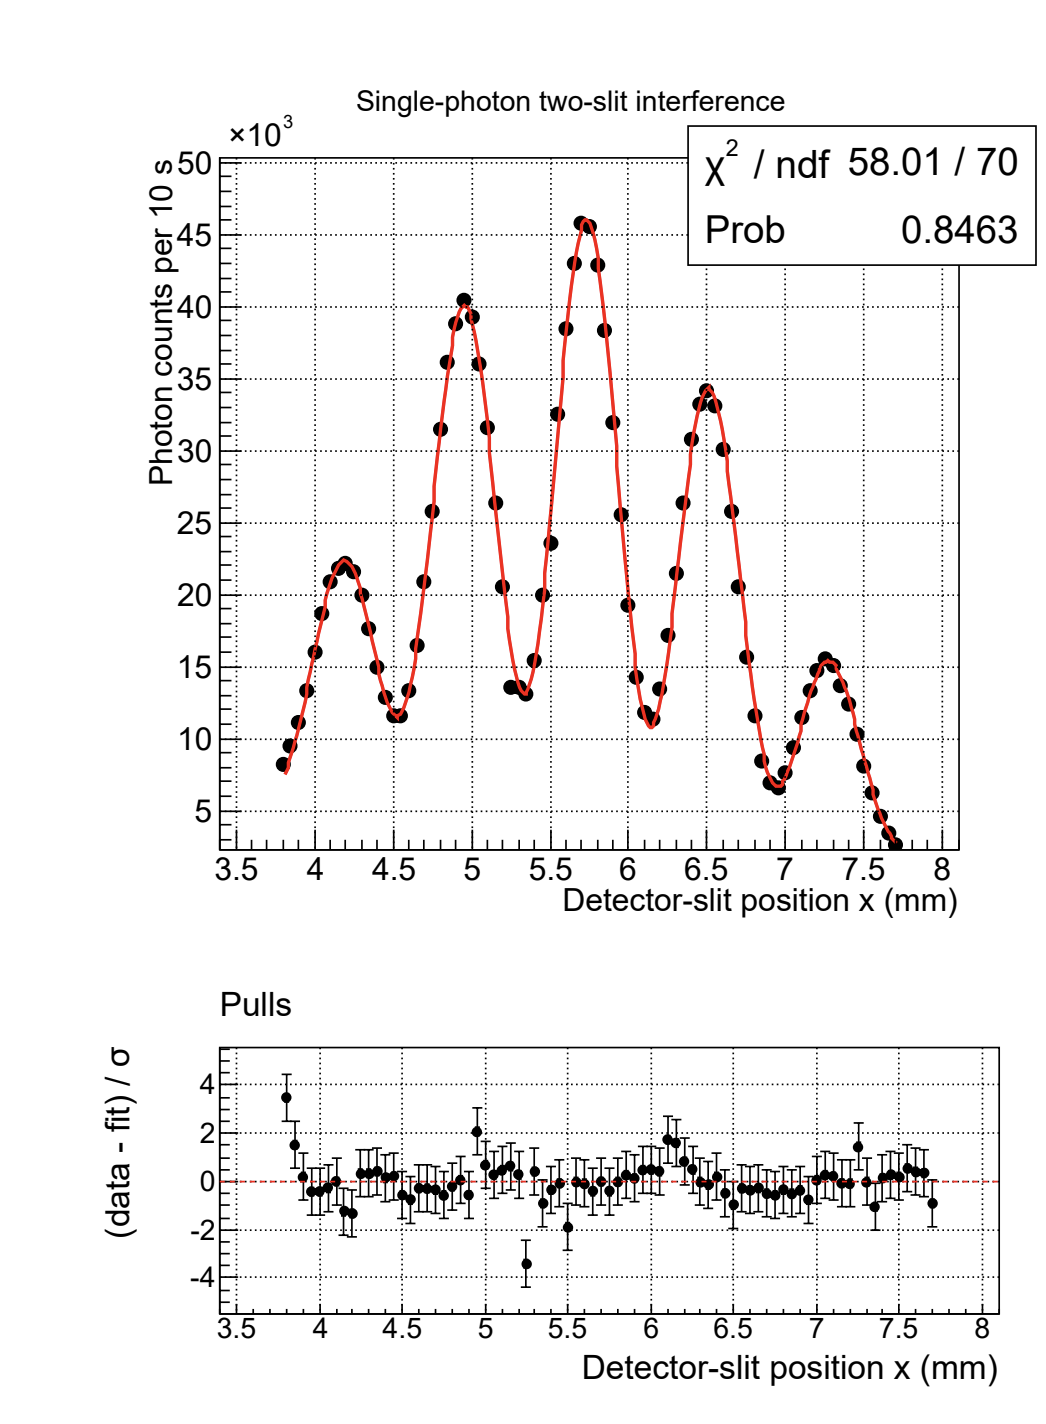
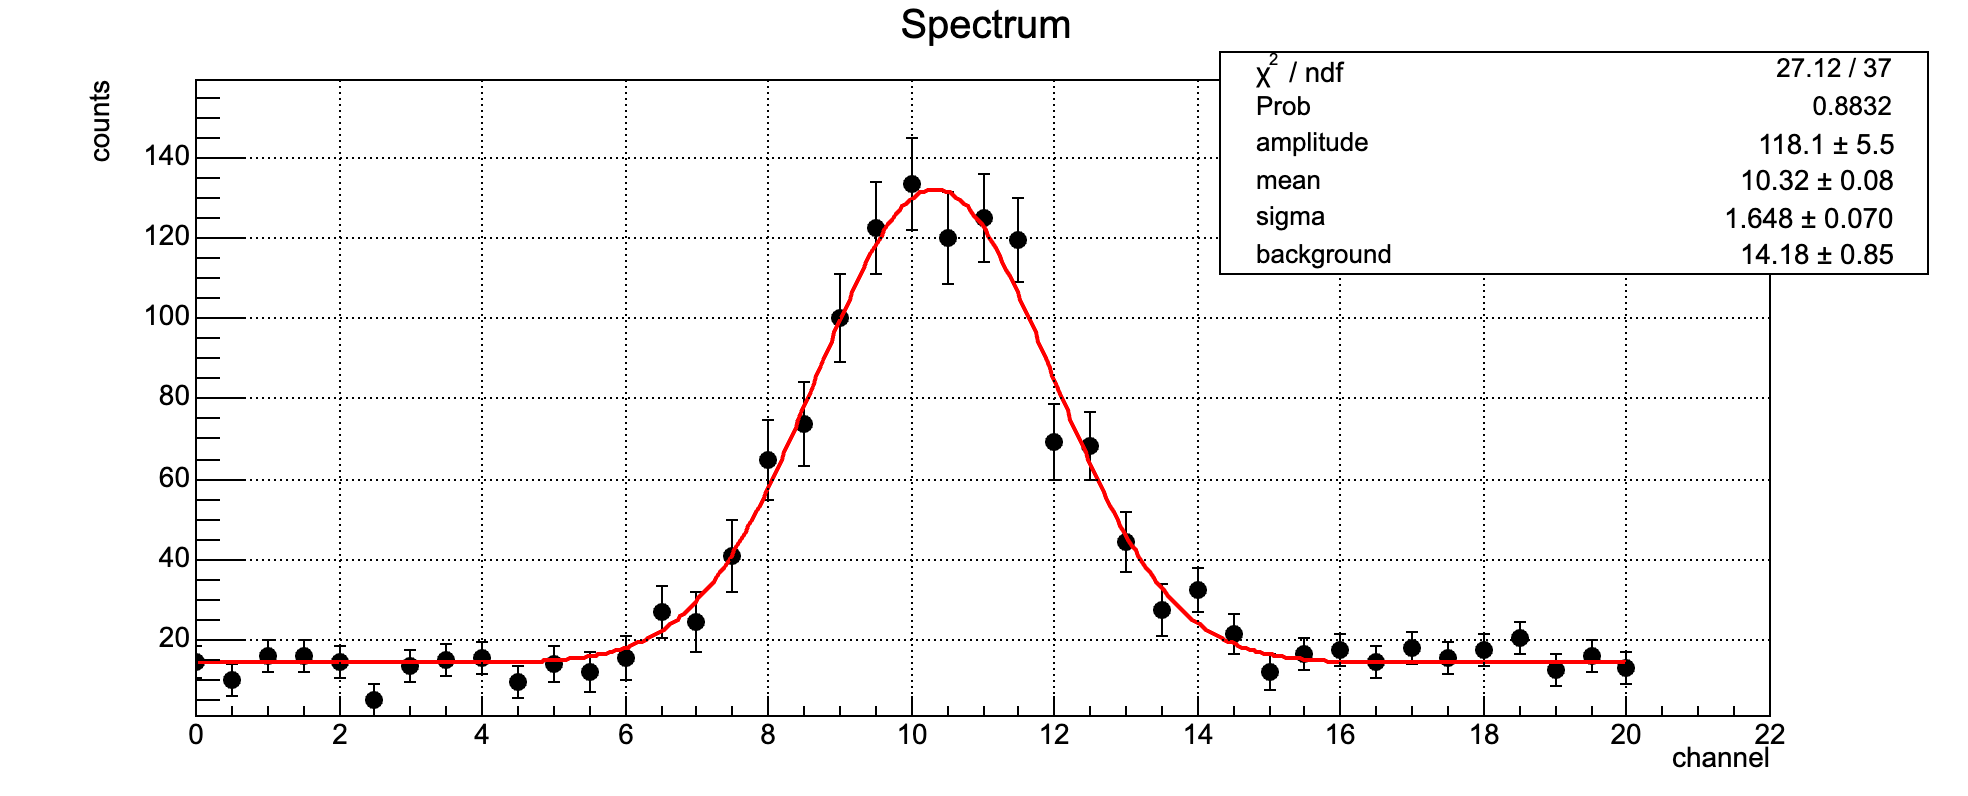
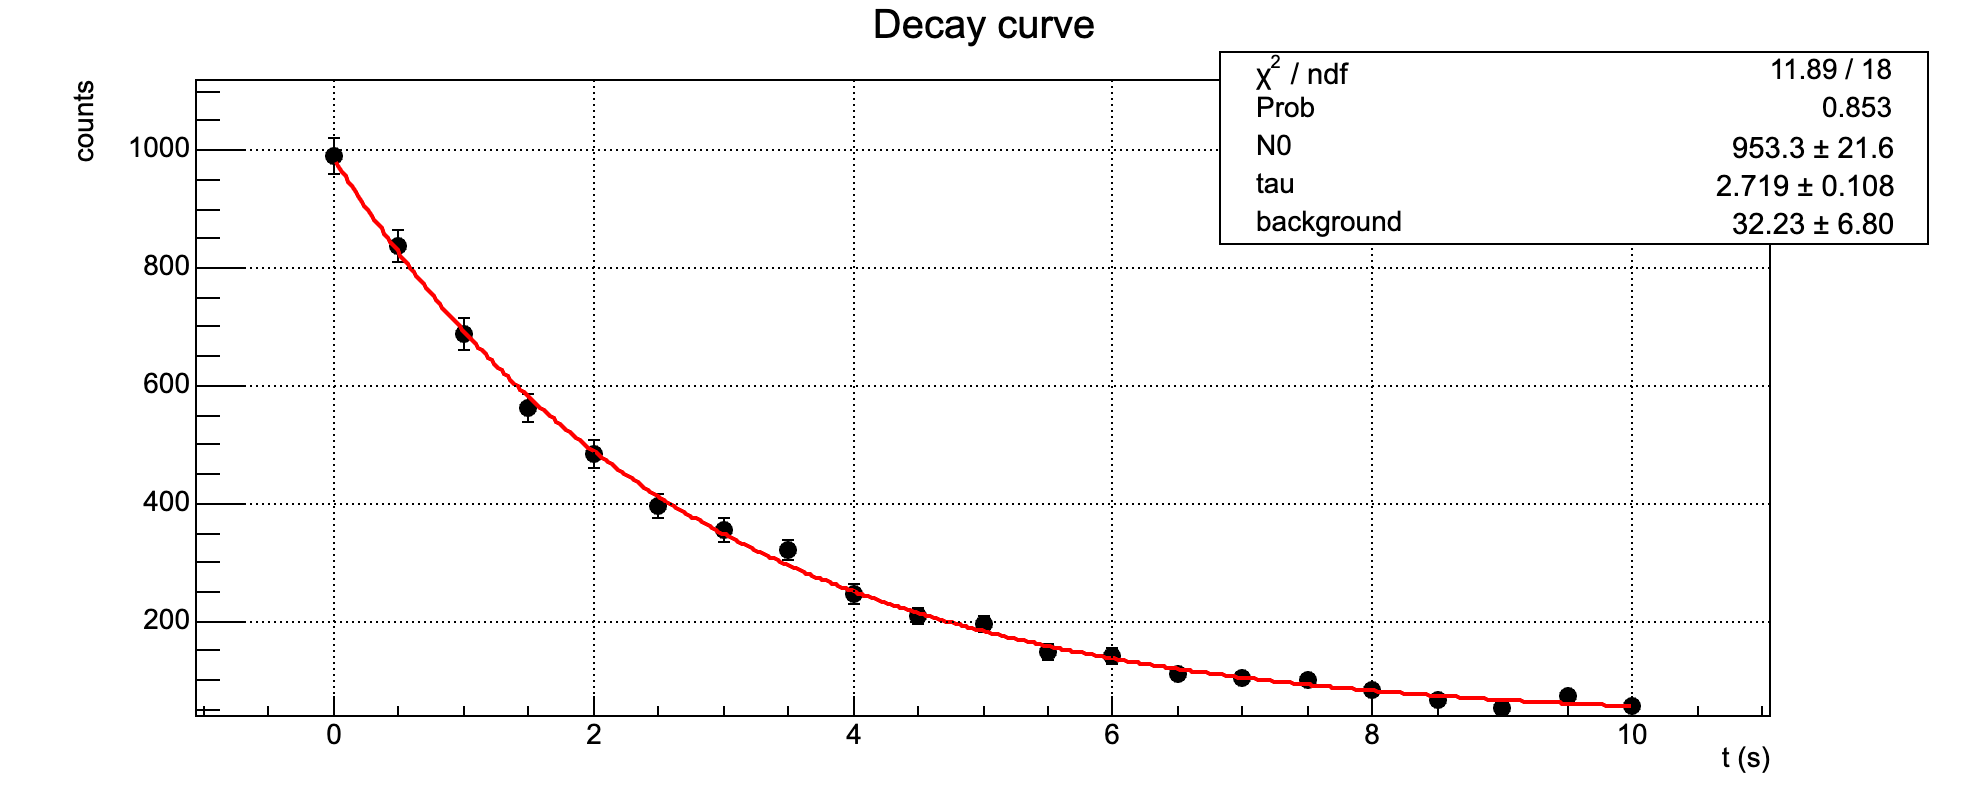
Fun fact: the plots that announced the Higgs boson were made with ROOT. Learn more about it here
New here? Read the documentation ·